 +
+
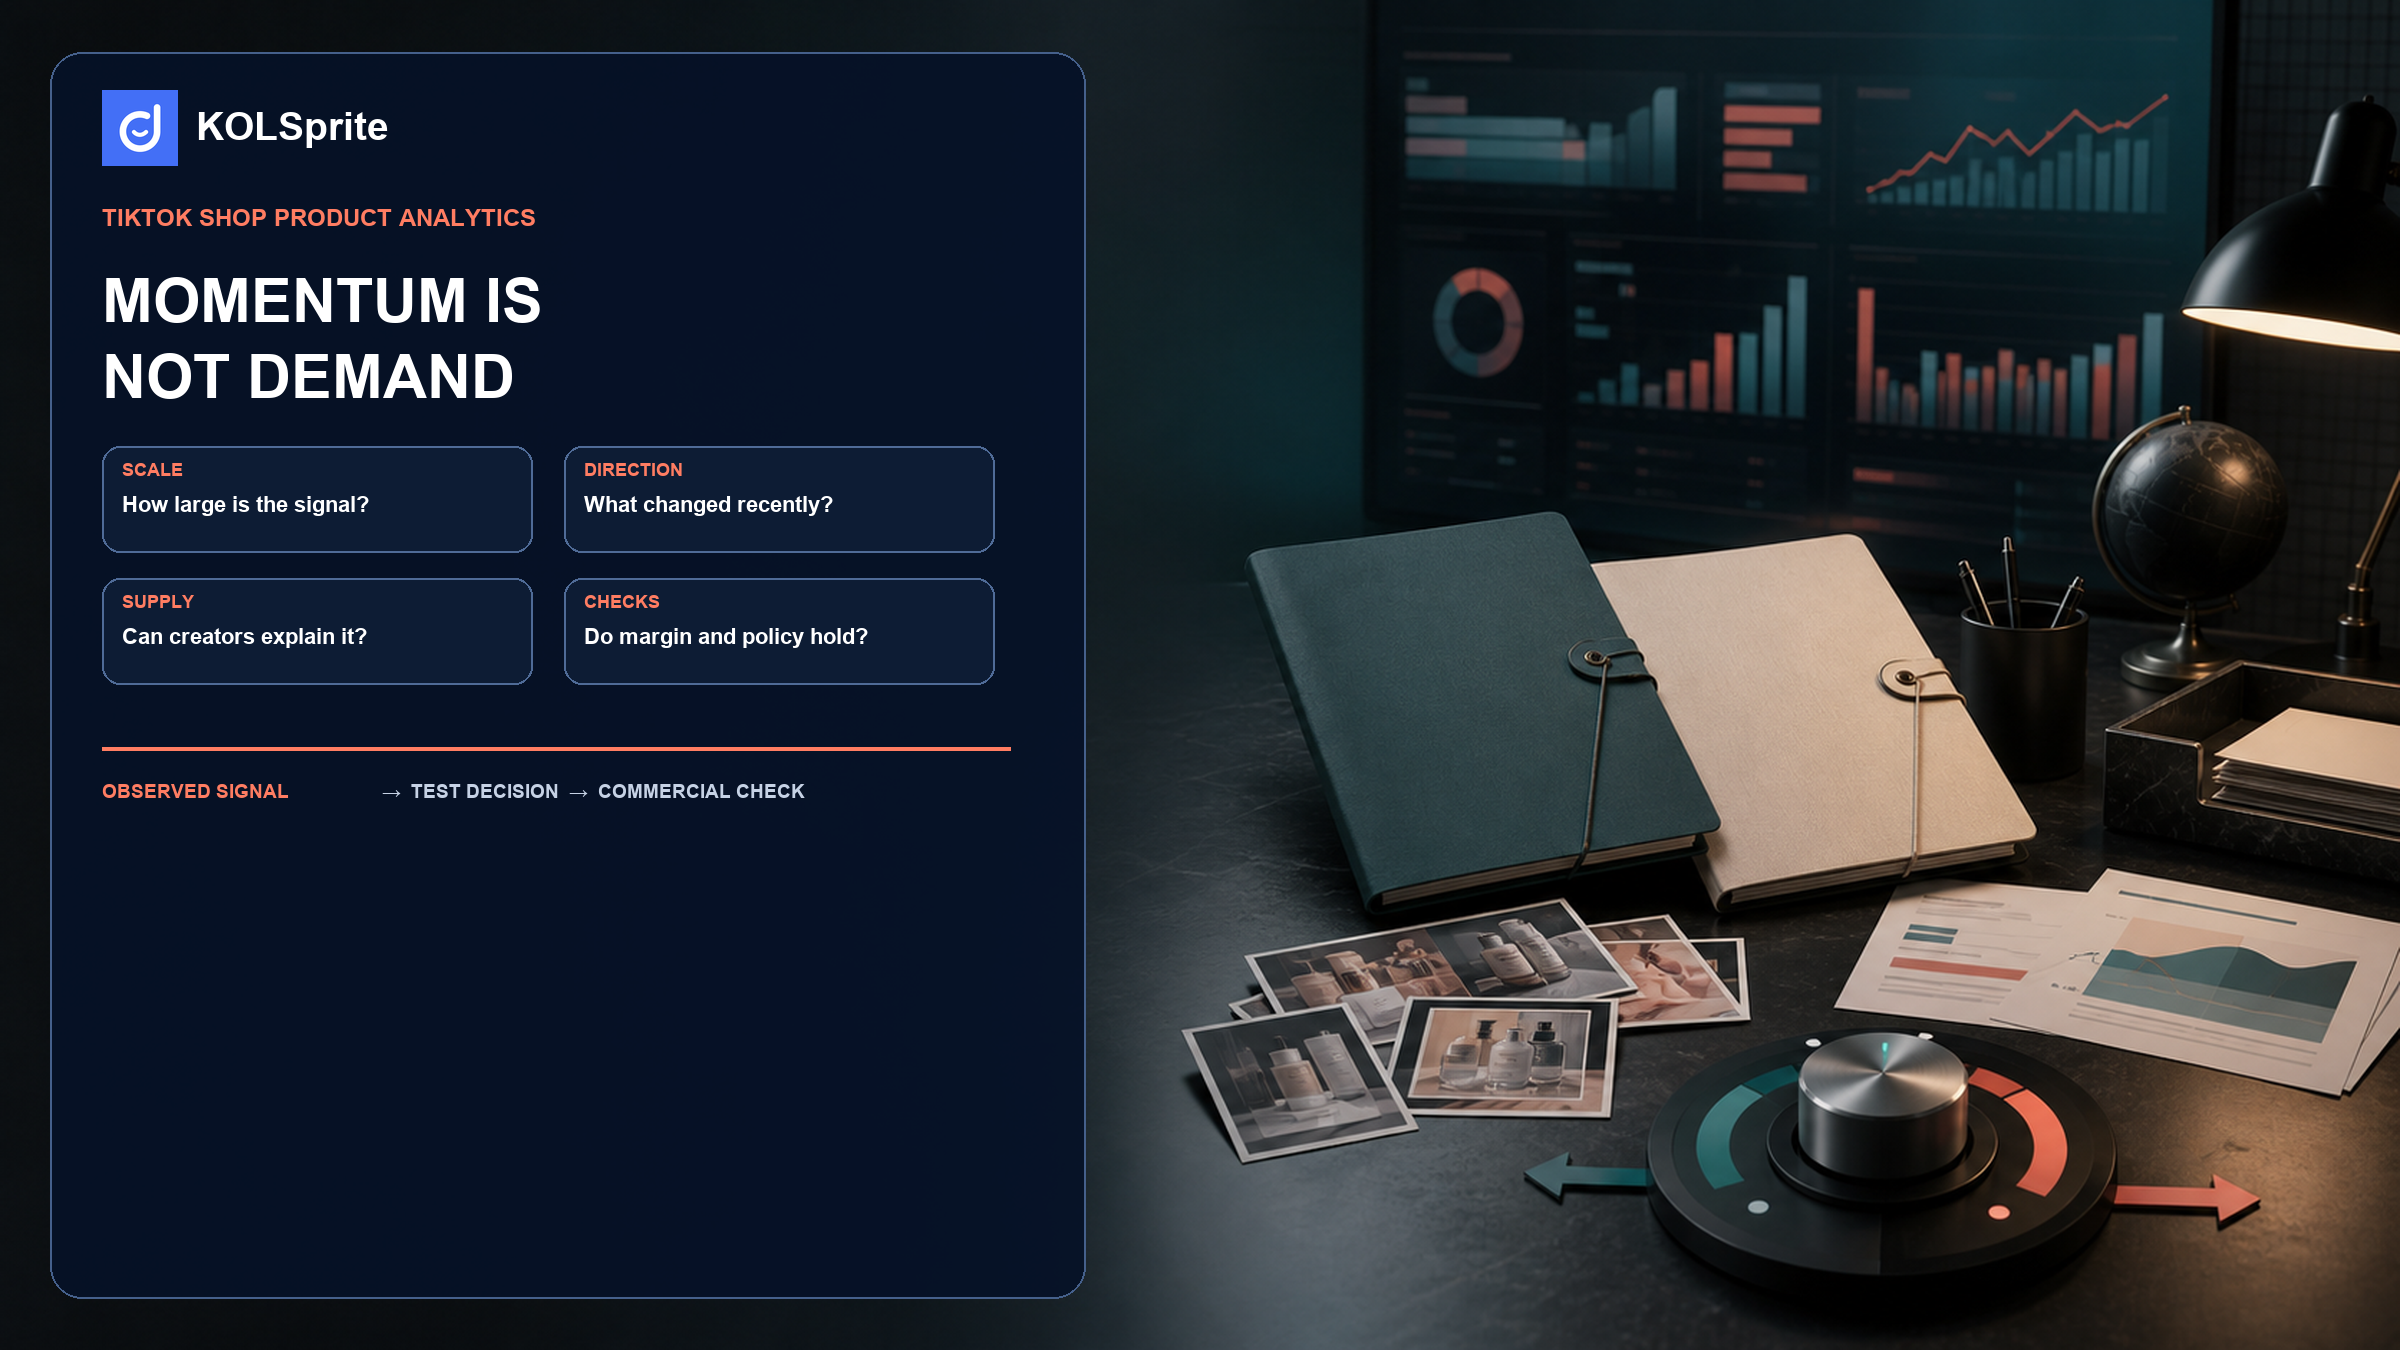
A category manager using TikTok Shop product analytics has four choices: investigate, run a capped test, add the product to a watch list, or reject it. High sales do not make that choice for you. Read scale and recent direction as separate signals. Then look at content supply and your own business limits. This field note provides a Momentum-versus-Demand card and a dated skincare example. Use both to keep a large total from turning into an unsupported claim about profit, stock feasibility, or future demand.
The most dangerous dashboard is the one that gives a clear answer too quickly. A product can have substantial 30-day units and still show negative recent growth. It can have many linked videos because it was widely promoted, rather than because a new buyer has room to enter. It can also have a small recent number that reflects an incomplete field or a short-lived spike. The screen shows figures; the operating decision needs an interpretation.
Give each field one job. Scale shows activity in the observed period. Direction shows whether the available comparison fields rise or fall. Content supply shows whether public creators and videos exist around the product. Economics covers your margin, fulfillment, returns, and compliance. Public research may show the first three. Your business records must supply the fourth. Keeping these jobs separate prevents a public metric from standing in for a private cost or operating limit.
Start with the number's time window. Check whether recent movement agrees with the total. Next, ask whether linked content offers a usable creative angle or simply shows a crowded field. See whether the rating and review count change your reading. Then name the commercial fact you still do not know. That last question often matters most. A product can deserve more research and still be wrong for your catalog.
Use these questions to keep “momentum” tied to the fields you can see. A large metric does not earn the label by itself. A drop does not mean “reject,” and a rise does not mean “buy.” Both tell the team what to check next. Record those checks so you can compare products later. No single score can remove every unknown.
| Observed product | 30-day units | 7-day units | 30-day growth | Linked creators / videos | Reading prompt |
|---|---|---|---|---|---|
| Collagen multi balm | 285,768 | 56,689 | -34.87% | 7,234 / 27,167 | Large observed scale and deep content supply, with a falling recent comparison field. |
| Turmeric and kojic soap bar | 122,562 | 230 | -99.71% | 868 / 1,185 | Large historical period figure beside a sharp negative recent comparison; investigate field quality and timing before any conclusion. |
Source and scope: dated KOLSprite public-data snapshot, US, accessed 2026-08-18. This bounded illustration is not a market estimate and the two records are not representative of skincare. Public fields may contain anomalies. TikTok Shop seller materials on product operations, seller features, and Shop guidance provide platform context, not a validation of these records.
KOLSprite can help you retain dated public product, creator, and video signals while your team applies the commercial checks the data cannot answer.
Register and claim a three-day trial
The multi balm is not automatically a winner. The snapshot shows a large 30-day unit count, a 7-day figure, and substantial linked creator and video supply. It also shows negative 7-day and 30-day growth fields. That combination may mean an established product is cooling, or it may reflect timing and other conditions outside the snapshot. The useful response is to inspect the public content and ask whether there is a distinct, permitted angle your team can test.
The soap bar is a stronger warning against one-number thinking. Its 30-day units look meaningful. Its 7-day units are much smaller and the 30-day growth field is sharply negative. That may be a late-cycle signal, a period comparison issue, or an anomaly. It does not prove a collapse. It does mean the team should not use the total as a purchase argument without checking inventory timing, claims, returns, and the source data.
Neither record tells you what it costs to acquire a buyer, whether stock can arrive on time, whether a claim is approved, or whether a similar offer works in another channel. Those are decision inputs from somewhere else. Public research earns its keep by narrowing questions, not by impersonating a profit model.
The same broad search also retained two commerce-video examples. The first video was 38 seconds long. It showed 11.7 million plays, 339,700 likes, 1,066 comments, a 3.77% interaction rate, and 8,237 30-day units. The second video was 14 seconds long. It showed 5 million plays, 131,000 likes, 615 comments, a 3.01% interaction rate, and 4,026 30-day units. Read video scale beside units so each field keeps its own meaning. These figures do not prove causation, creator quality, or a script that another team can reuse.
Inspect public content for the actual question it can answer: What is shown early? Is the product use clear? What objections appear in comments? Does the creative depend on a person, a price, or a product fact you cannot reproduce? A high volume of linked videos can make a category easier to study and harder to enter. The distinction belongs on the decision card.
Join the KOLSprite Discord to compare product-research decisions with sellers who separate public activity from inventory, margin, and compliance work.
 +
+
Join the KOLSprite Discord community
Put the date and market at the top of one page. Add the scale fields and direction fields. Then record the relevant public content evidence, one anomaly or conflict, and the next decision. Do not reduce the card to a green, yellow, or red dot until the team writes down the missing commercial facts. “Investigate public creative, then check margin and returns” is stronger than “high potential.” It gives an owner a next step and tells the next reviewer which facts still need support.
KOLSprite can help a team search for products and save dated scale and growth fields. It can also help the team review linked public creators, videos, and other public content. Use that output with a rejection test, such as TikTok Shop product research. An evidence-based seller validation adds another check. For a wider view, use this product-research evidence map to keep sources separate.
KOLSprite does not prove profit or sales attribution. It does not show that stock can arrive on time, predict refund risk or future demand, or prove that a public signal caused a sale. Public fields may contain errors or odd values. Write those limits next to the numbers before anyone commits money.
An anomaly is not an embarrassment in a research note. It is a reason to slow down. A very large gap between two time windows may reflect real change, but the reading should include questions about the record, the comparison period, and the product’s current availability. Do not smooth the discrepancy by averaging it away. Record it, then decide which additional source or business check could resolve it.
Use the same discipline for ratings and reviews. A rating can provide customer-feedback context; it cannot establish a margin, a repeat-purchase rate, or a compliant claim. Reviews can point toward language to investigate in public content, but they should not be rewritten as product facts. Keep a distinction between observed fields and the hypothesis they make worth testing.
Before you spend on stock or creative, move the product card to a business review. Add landed cost, selling price, and the stock on hand. Check shipping limits, return risk, approved claims, and channel conflicts too. These facts may reverse a good public signal. That is a sound result. The public snapshot did its job if it kept the team from spending time on an item that fails a basic operating limit.
Likewise, a negative direction field does not always mean “reject.” It may support a small, capped creative test when the economics work and the public content suggests a clear learning opportunity. State the cap and the decision trigger in advance. The team then knows whether it is testing a fresh angle, monitoring a decline, or simply gathering better evidence.
Every public metric should carry its observed date and market. That practice keeps an old screenshot from being treated like a current forecast. It also makes repeat research more useful: when the team checks again, it can compare the new record with the old one instead of arguing from memory. Product analytics becomes more reliable when the record shows its age.
A final check is whether the decision would change if one attractive field disappeared. If the answer is yes, the team is leaning on too little evidence. Add another dated observation or narrow the action to a smaller test. If the answer is no, write the reason. That gives the category manager an audit trail for the judgment, rather than a dashboard image that cannot explain why inventory or creative funds moved.
Apply the same test when you compare products. Do not rank a balm ahead of a soap bar just because one total is larger. Write down each time window and the recent direction. Add the public content context, your business limits, and the facts you still need. If the record cannot support that comparison, it cannot support a spending decision yet. Waiting is a valid TikTok Shop product analytics result. It keeps a dashboard total from passing as a commercial recommendation.
Latest Articles

As an essential, data-driven toolkit for TikTok influencers and marketers, KOLSprite provides powerful features for effortless creator discovery, trending content identification, and actionable real-time insights.
It empowers users to make smarter decisions and significantly boosts their TikTok business.

 Refer & Earn