 +
If you run a shop or build reports for one, start by asking whose record you need. Use authorized order data to check a sale or refund, Seller Center analytics to explain a change in your own store, and outside listing estimates to compare products you don't sell. Those are three uses of TikTok Shop data, not three views of the same ledger. Here's how to choose a source before you spend a week setting up a report no one can trust.
Picture a seller who notices that the same product appears in two reports. The warehouse wants to know which order needs to go out. The person running the shop wants to know why fewer visitors bought that item last week. The buyer on the team wants to know whether a similar item at another shop merits a closer look. If all three ask for a sales export, they sound like they want the same file. In practice, the three files would serve different people.
An order is a thing the warehouse can act on. A product report can show how the store performed across many orders. A market estimate points to something worth looking at outside your store. If you know which of those outputs you need, you can often tell from the first few fields whether a source is a fit. You don't have to wait for a full download to find out the row isn't usable.
A question about a refund needs more than a number for a product. Someone has to be able to find the right order and check what happened to it. A question about why a product sold better could start with traffic and orders together. And a product you don't sell calls for an entirely different record. There is no order from that other shop for your team to open.
TikTok Shop's Get Order List documentation describes a shop-level request with a seller access token and a required permission scope. It can return orders created or updated in a requested period, with filters such as order status. That makes it useful for a team that has the right access and needs orders it can act on. It doesn't grant access to the orders of any shop name you type in.
The choice between created and updated dates matters before you make a daily report. An order may have been placed before the day you're reviewing and have changed status during it. A support queue may care about the change. A report about orders newly placed that day cares about when the order began. Both can use authorized order data. They still need different date rules, otherwise one team will ask why the orders in the other report don't match.
For performance questions, TikTok Shop's guide to Product Analytics in Seller Center describes product and SKU views with separate metrics for GMV, orders and units sold. It also explains how to choose dates within the past 90 days. That's a better place to start if your team needs to see how one item did across a period rather than find one order that changed.
For example, in a hypothetical shop, orders might stay flat on a day when units rise. A buyer can order more than one item. A report about items shipped and a report about checks placed will need different labels. A data source that calls one quantity units and the other orders has already done you a favor. The labels are worth keeping even when the spreadsheet looks busier with both of them.
Use the same market and time window, then save the listing identity next to the estimate.
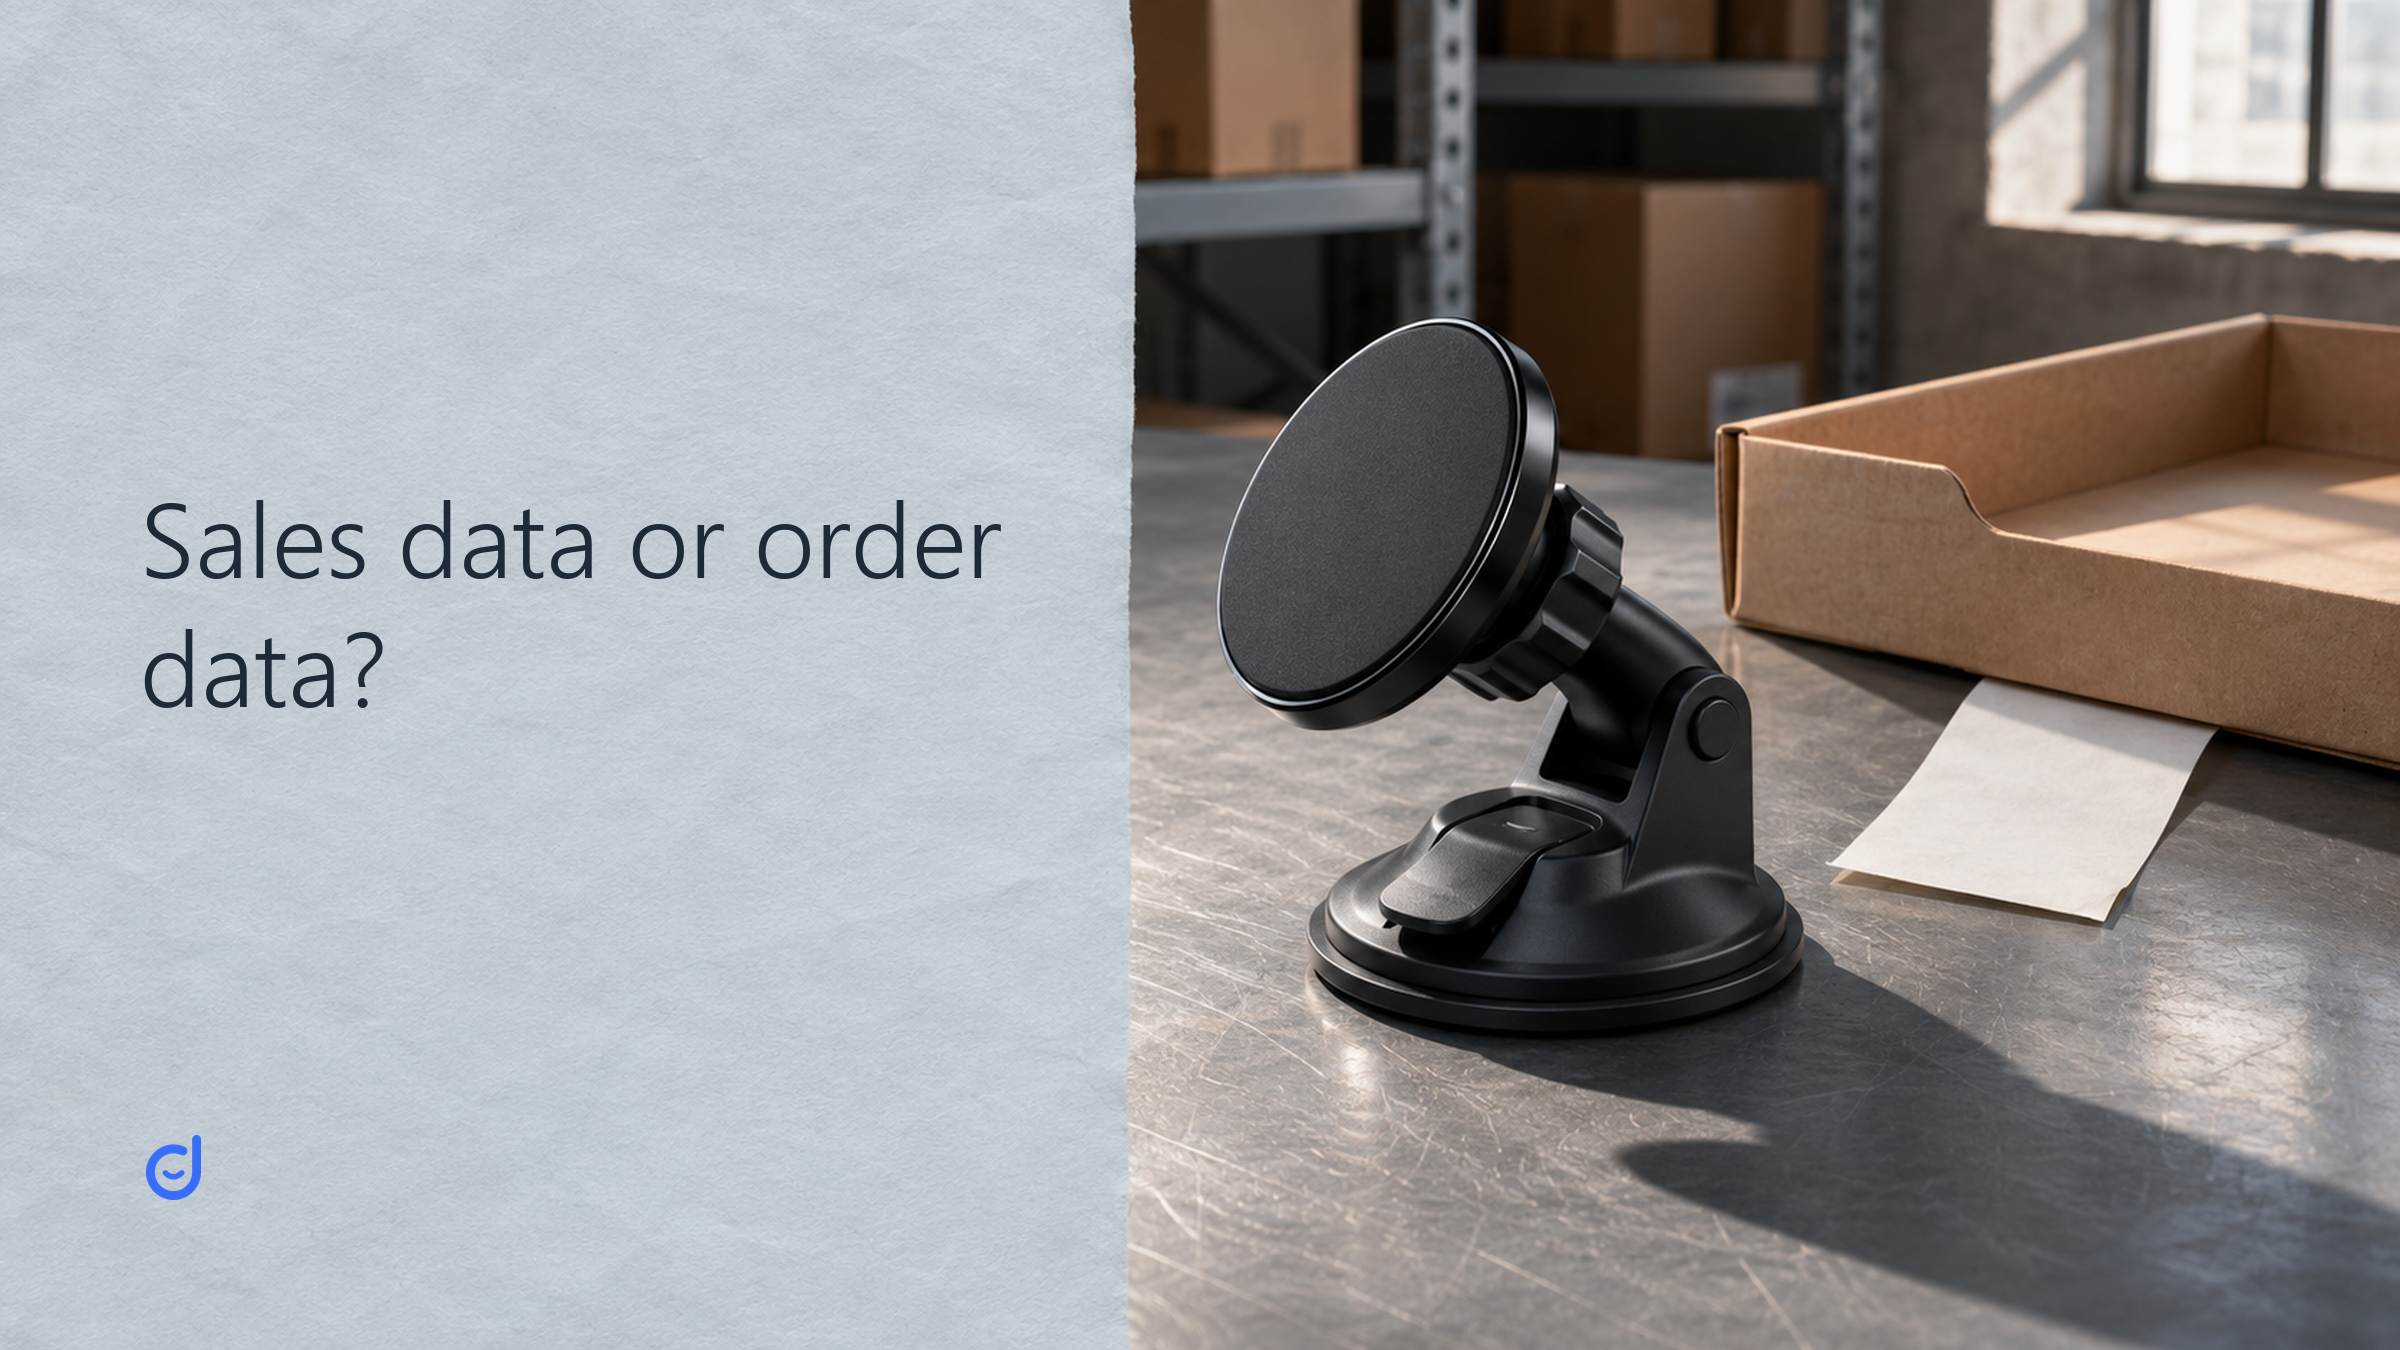
Suppose you're checking a seller that offers a magnetic phone mount. A quick market search can tell you whether there is an item worth inspecting. It's not a way to find who bought it. There are fewer things you can learn from one product record than you can from the records you have a right to see for your own store.
| Returned item | Reported listing fields | Question it can help answer |
|---|---|---|
| ZapRim magnetic car mount, ID 1732596482179371198 | $17.99; estimated 8,292 units in seven days and 29,846 in 30 days | Is this named, priced listing useful enough to put in the market comparison? |
KOLSprite US product research, checked November 19, 2026. This is one listing from a three-result lookup. The figures are provider estimates over two different periods, not the seller's order records.
In KOLSprite product research, a seller can search for a comparable item in the right market, check the returned title and shop, and record one listing ID with its price and time window. This search also returned a suction-cup bracket and a tripod. Neither title establishes that it's a good stand-in for the named magnetic mount. The match matters as much as the number.
The outside record isn't a private order feed. It doesn't tell you what the seller kept after refunds or charges. Nor does the seven-day total prove that demand has sped up. More days were counted in the 30-day figure. If a question is really about a shift over time, make sure the periods line up before you try to tell momentum from demand.
Identify the right source for a question about orders, store trends, or public competitor activity.
 +
Join the KOLSprite Discord community
You don't need three separate files if the team needs to see the results side by side. You do need to make it hard for someone to read them as interchangeable. An order tab could carry one row per order, an own-shop tab one row per product per period, and a market tab one row per comparable listing and observation day. A store may need more detail than that, but the names tell the next person what each tab is for.
Consider a buyer who brings the ZapRim example to a planning call. They can put the price beside the estimated units to show why they picked this item for a closer look. They can't multiply the advertised price by the estimated units and call the result the seller's receipts. The sold prices need not be the price shown when the analyst looked. And the calculation would still not reveal what was paid out. The note should explain why the item is relevant, not rest on a revenue figure it can't support.
In the same meeting, the team's own-store report may show that more people bought an item but fewer units went out in each order. That's a question the team can check using its own data, with no need to pull competitor estimates into the calculation. Competitor numbers could still suggest which offers to study, but they should stay in the market part of the report. The point of the split is to make it clear who can take the next action.
A report owner can set one rule for joins: only combine sources when both sides describe the same record, period and measure. Matching titles isn't enough. Matching the calendar week isn't enough either if one figure counts ordered units and another counts shipped units. Leaving two figures next to each other with separate labels often answers the business question better than a forced join.
Say the next report is due on Monday and the market estimate was captured on Friday. The chart can still use both figures if the note makes the dates clear. For the own-store question, you may want Monday's view of the prior week's orders. For the market question, you may want to know which product was worth a look as of Friday's snapshot. Joining them into a single weekly total would hide both facts. A clear date in the column title does more for the reader than a prettier chart.
The right place for missing values depends on the same choice. A missing status in an authorized feed may call for someone to check the order. A missing estimate on an outside listing doesn't give the research team a reason to put a zero in its place. The market report can show that the estimate wasn't available and tell the buyer whether to try another comparable or leave that part of the question open.
Before you automate the report, try it for one week with an example that matters. If the warehouse needs to find orders that changed status, have someone show the note they'd use to track one affected order. If the store manager wants to see whether an item turned more visits into sales, have them open the product view for a known date range. And if your buyer wants a list of competing products, ask them to show how they chose one comparable they can identify again next week.
That exercise tells you where to do more work. If the reporting team still can't find which date the order was placed, they need a cleaner record, not more outside numbers. If the buyer has six broad search matches with no reason for choosing one, they need a better search or an exclusion rule. Those are different next steps. The Seller Center research and execution map helps when you're not sure which parts of the job stay inside the shop.
For outside comparisons with a clear item, period and limit, you can take external data into a research workflow without turning it into a second order book. The question to ask of TikTok Shop data is simple: what action can someone take from this row, and what would they need to verify somewhere else? If that answer fits the work, the team can trust the report for the job it was built to do.
Latest Articles

As an essential, data-driven toolkit for TikTok influencers and marketers, KOLSprite provides powerful features for effortless creator discovery, trending content identification, and actionable real-time insights.
It empowers users to make smarter decisions and significantly boosts their TikTok business.

 Refer & Earn