 +
+
One report says conversion fell. Another shows orders rising. Both can be right. The numbers may use different denominators, date ranges, or traffic sources. A rate only has meaning when its numerator and denominator travel together. Before changing a listing, a price, or a video, write down exactly what the rate divides.
For a TikTok Shop owner, the first useful question is often not “What is a good conversion rate?” It is “Which people or events are in this rate?” That question can stop a bad fix. The real change may be clicks, content mix, or the report definition.
TikTok's US Product Traffic Analysis guide says that conversion rate was renamed CTOR (SKU orders). The calculation remains the same: SKU orders are the numerator and product-link clicks are the denominator. The guide is dated May 9, 2026. The name change does not turn the metric into video views, nor does it make it a count of unique buyers.
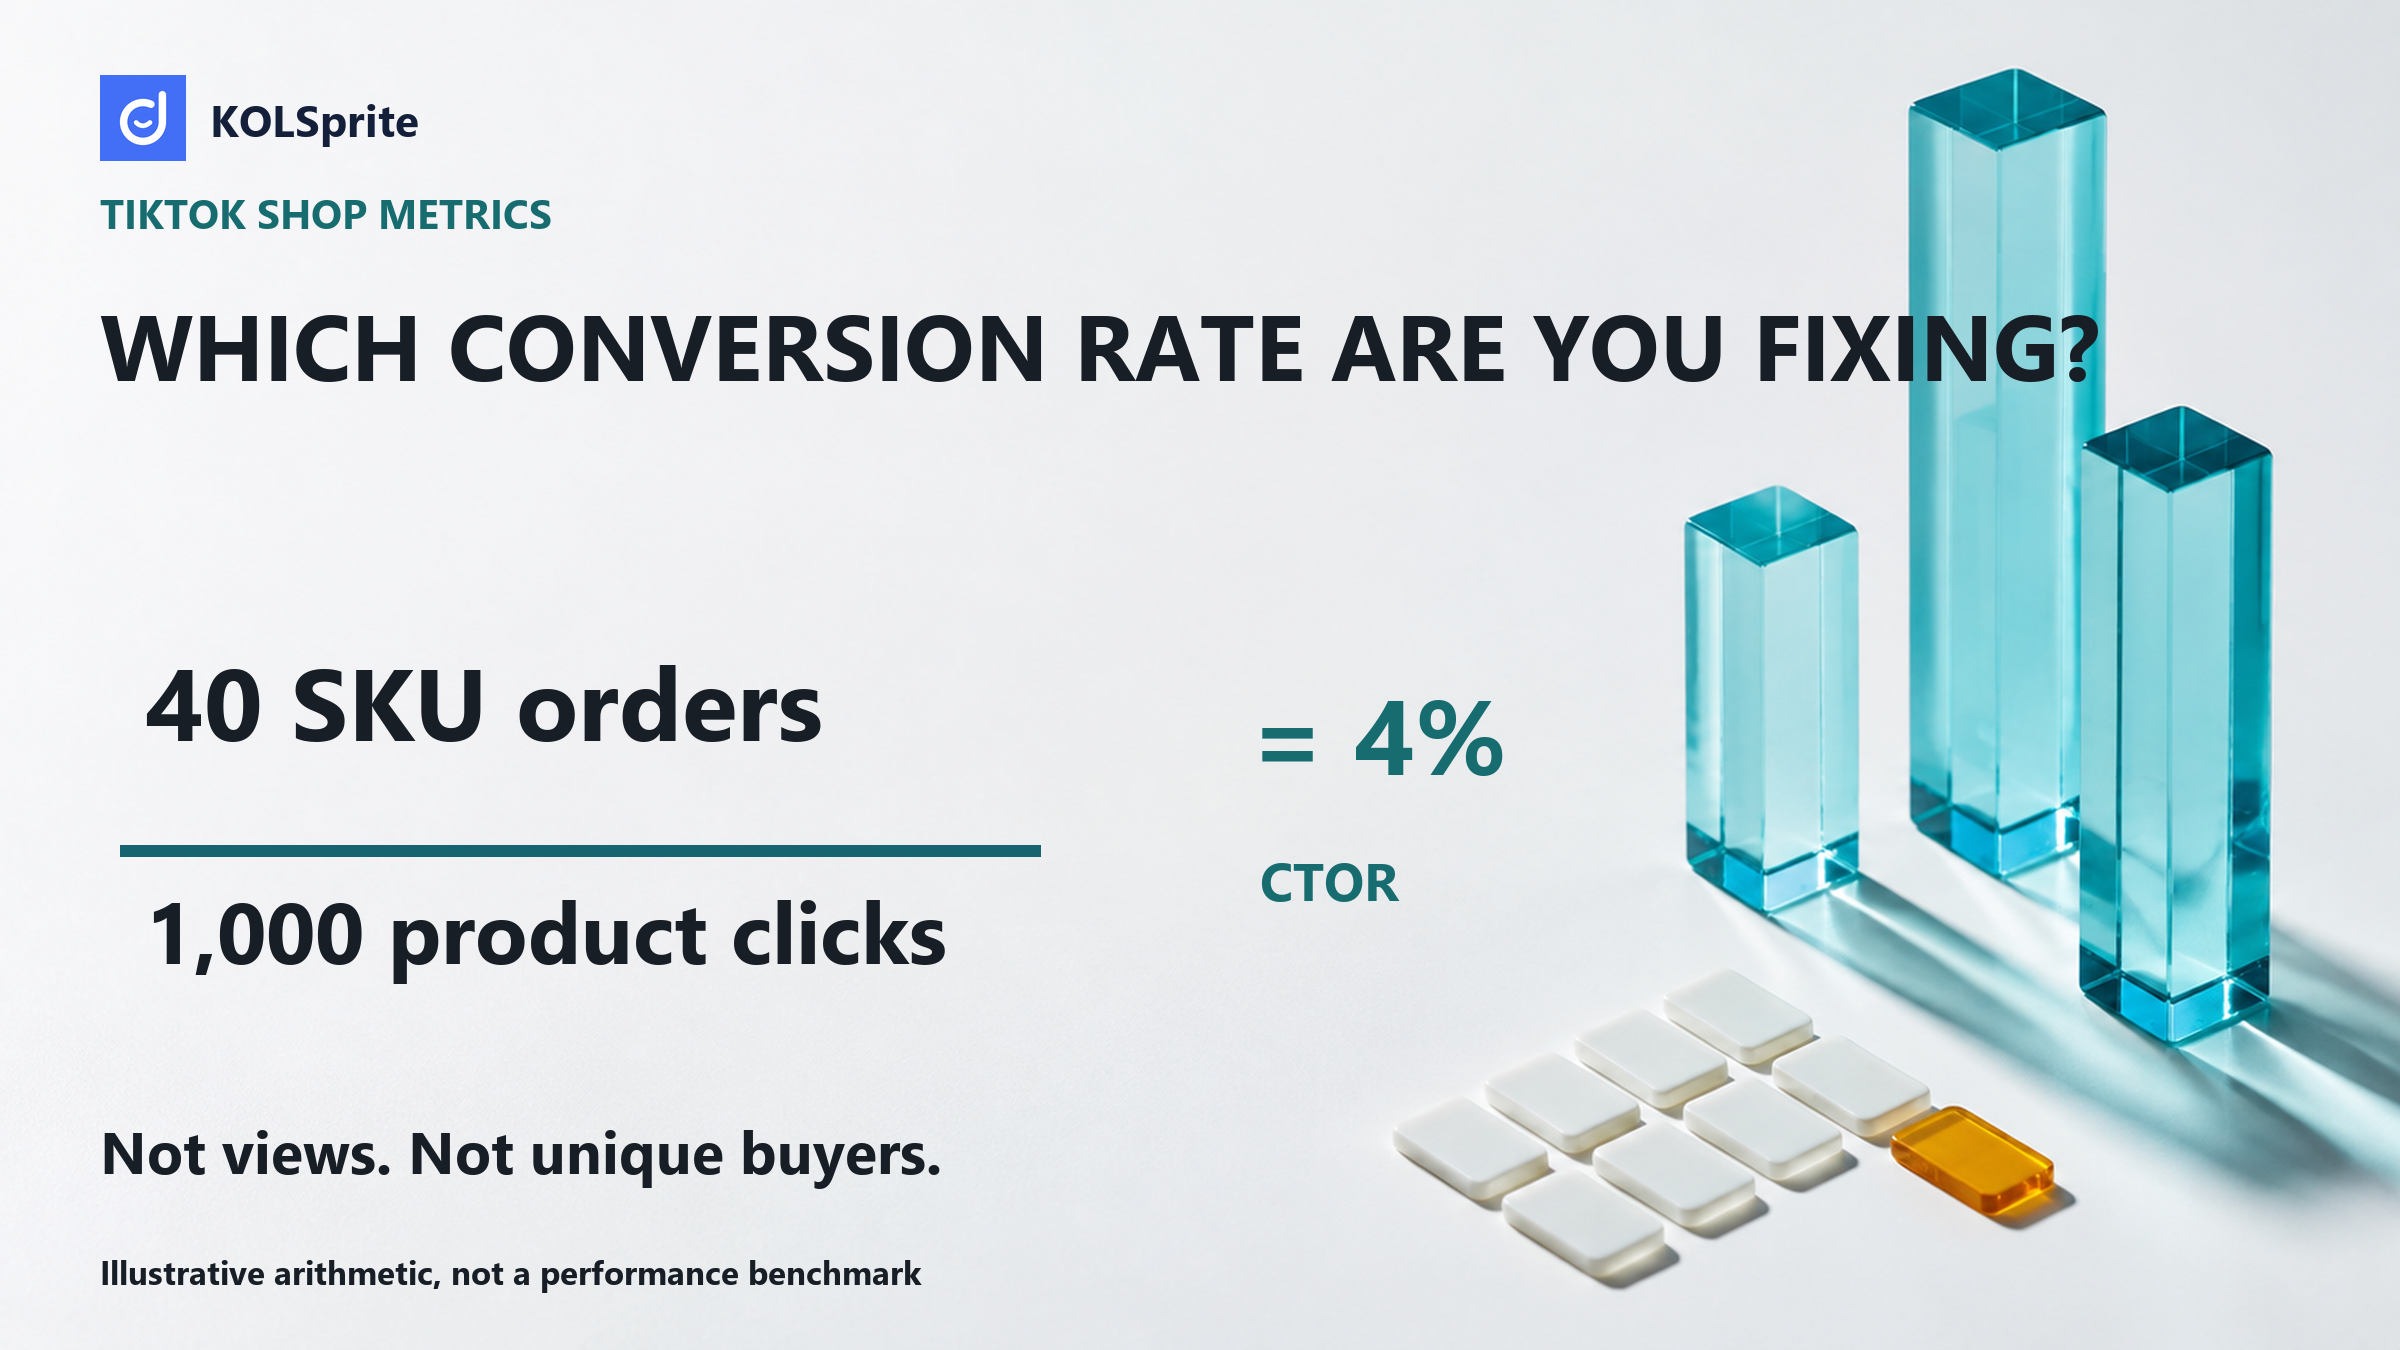
Write it plainly: CTOR (SKU orders) = SKU orders / product-link clicks. If 40 SKU orders came from 1,000 product-link clicks in the same period and scope, CTOR is 4%. That is a clean example. It is not a benchmark or a claim about a real shop.
| Metric term | Numerator | Denominator | Do not replace it with |
|---|---|---|---|
| CTOR (SKU orders) | SKU orders | Product-link clicks | Video views |
| PV views | Not part of CTOR | Not part of CTOR | Unique viewers |
| UV views | Not part of CTOR | Not part of CTOR | Product-link clicks |
Source: TikTok Shop Product Traffic Analysis guide, May 9, 2026. Scope: CTOR definition. Market: US. Access date: September 2, 2026. Sample: one official guide. Cleaning: kept SKU orders and product-link clicks separate from views. Limit: definitions only, not a shop result or benchmark; refunds may occur later.
Use TikTok Shop's Product Traffic Analysis guide to confirm the current field label in your account. Do not mix it with a different dashboard metric because the word conversion appears in both places.
A video view can tell you that content reached a viewer. A product-link click can tell you that a viewer took a step toward the product. A SKU order tells you that an order was placed. These are linked events, but they are not interchangeable.
Suppose a new video gets far more views than last week but reaches a broad audience with weak buying intent. Product-link clicks may rise a little while CTOR falls. That does not prove the product page broke. It may mean the added traffic was less ready to buy. In the opposite case, a small group of high-intent clicks can lift CTOR while total orders stay flat because the shop had fewer clicks.
PV and UV views add another distinction. PV means page views. UV means unique viewers. Neither should be quietly substituted for product-link clicks in the CTOR equation. The moment a team uses views under the word conversion, it loses the ability to tell whether the problem is content reach, product interest, or the click-to-order path.
Try KOLSprite web product and video research with a three-day registration trial. Keep Seller Center as the source for your own clicks, orders, and costs. MCP requires separate access.
Register and claim a three-day trial
Here is a hypothetical comparison. In week one, a product receives 500 product-link clicks and 30 SKU orders. CTOR is 6%. In week two, a creator video sends 1,500 clicks and 60 SKU orders. CTOR is 4%. Orders doubled while CTOR fell.
Neither number says the store got worse on its own. The team needs to ask what changed in the clicks. Did the new video reach a colder audience? Did the product link appear on more broad content? Did the price change? Did the week contain a different promotion? A lower rate can be a traffic-mix story. It can also be a listing, price, or stock story. The denominator is where the first diagnosis begins.
Now change the comparison. Week three has 400 clicks and 28 orders, for a 7% CTOR. The rate rose, but orders fell. A team that only celebrates the percentage may miss the loss of demand. Put clicks, orders, and CTOR in the same note. They make each other understandable.
A sound comparison uses the same date range, product scope, and traffic source. A seven-day rate and a 30-day rate do not answer the same question. A store total and a single SKU rate do not answer the same question. A creator-linked product path and an all-shop path may not answer the same question either.
Make a tiny comparison header before the numbers:
This header may feel basic. It saves time because it stops a meeting from debating a rate that was built from incompatible reports. It also gives the next analyst a way to reproduce the comparison without guessing.
When any part of the header changes, label the comparison as directional. Do not use it as proof that one store action caused the rate to move.
After you define the metric, choose one intervention. Do not change the video hook, price, product page, and offer at once. If all four change, the result cannot tell you which step improved.
If views are weak but product-link clicks per relevant view are healthy, the content may need a better opening or more distribution. If clicks are healthy but CTOR is weak within a consistent scope, inspect the product detail, price, shipping promise, stock status, and offer clarity. If CTOR is healthy but order volume is low, the shop may need more qualified clicks rather than a checkout rebuild.
Use plain hypotheses. “The product page is bad” is not a test. “The size is unclear before the buyer clicks, so we will add a held-in-hand size shot to one creator brief” is a test. Set a time window and keep the rest of the path stable where you can. Then compare the matching numerator and denominator again.
Use this note when a chart creates urgency:
A hypothetical note might say that CTOR fell from 6% to 4% while clicks rose from 500 to 1,500 and orders rose from 30 to 60. The team would not call checkout broken. It would review the new content's traffic mix and test one clearer product cue. The note makes the choice visible and keeps the next report honest.
Join the KOLSprite Discord to discuss a metric definition or a hypothetical example. You do not need to share private sales data to make the calculation clear.
 +
+
Join the KOLSprite Discord community
CTOR uses SKU orders in the stated definition. Refunds can happen later than the order period. That timing means CTOR is not a final profit or satisfaction metric. A team should not rewrite the definition to force refunds into the click-to-order rate. It should track a separate refund view with its own period and reason codes.
For example, a product could show stable CTOR but a growing return pattern. The click-to-order path may be working while the product expectation is not. The response could be clearer content, a better size guide, or an operational fix. Treating that issue as a CTOR decline would hide the real work.
Keep the metrics side by side: clicks, SKU orders, CTOR, refunds recorded later, and the most common refund reason. The order metric describes one stage. The refund record describes a later outcome. Both matter, but they should not be blended into a rate without a stated method.
KOLSprite product research can help form the next creative hypothesis by comparing public offers in your category. Save the comparable prices and product details beside the idea you want to test. These fields cannot reveal private product-link clicks or diagnose checkout. A public view count is not a substitute for the denominator inside your Seller Center report.
That boundary makes the workflow more useful. First, inspect your own funnel with the same definitions. Then use outside context to form a narrow content idea. For example, the team might notice a product setup worth testing, but it should judge the test with its own clicks and SKU orders. KOLSprite can support the context step; it cannot see the private funnel needed for this diagnosis.
A low rate can be real. It can also be a bad comparison. The cure is not a generic conversion benchmark. It is a consistent numerator, denominator, period, and channel. Once those are set, the team can choose whether it has a click problem, an order problem, or a traffic-mix problem.
Set up the reporting flow with the TikTok Shop analytics guide. Add external offer context by checking product momentum and demand. Keep later order value in view with the creator ROI framework.
Disagreement between dashboards does not by itself make either one wrong. Check the denominator first. Then compare clicks, orders, and CTOR within the same scope. Use that comparison to choose one stage to fix at a time. Keep refunds as a separate later check, outside that initial diagnosis.
Latest Articles

As an essential, data-driven toolkit for TikTok influencers and marketers, KOLSprite provides powerful features for effortless creator discovery, trending content identification, and actionable real-time insights.
It empowers users to make smarter decisions and significantly boosts their TikTok business.

 Refer & Earn