 +
+
If you run a TikTok Shop, a falling number does not tell you what to fix. It may point to weaker traffic, lower sales rate, a tired offer, thin creator coverage, stock limits, or a product that should lose priority. This guide turns TikTok Shop analytics into one choice map. You will connect official shop and product metrics with outside product, shop, and video evidence, then add the private facts only your business knows. The result is not another dashboard. It is a dated choice: protect stock, change the offer, refresh proof, run a small test, or stop.
Start with the choice, not the chart. Assign every metric to one question and one owner. Use official Seller Center data for your own funnel, KOLSprite for connected market and content evidence, and your finance and operations records for margin, returns, and stock.
A dashboard is not a choice. It is a queue of questions with owners.
A seller can spend an hour moving between panels and still end a meeting with “let us watch it.” That happens when the team has not named the choice. Write it before opening a report. For example: “Should we keep the electric spin scrubber at its current offer, change the creative plan, or reduce the next stock commitment?”
That sentence narrows the work. Traffic metrics can show whether fewer shoppers reached the product. Sales rate metrics can show whether the listing turned visits into orders. Market records can show whether other sellers and creators still have activity around the item. Video evidence can show whether the product is still being demonstrated in more than one way. Margin, refunds, stock, and support costs decide whether any recovery plan is worth funding.
TikTok Shop's official Product Analytics guide explains that sellers can review product status, GMV, orders, units sold, impressions, page views, click-through rate, sales rate rate, traffic sources, and up to 90 days of results. Those are first-party facts about your shop. They should be the starting point for a review, not the only evidence in it.
The fastest way to misuse analytics is to ask one source to answer a question it cannot see. Seller Center can show your shop's funnel. It cannot tell you whether a competitor's product has wider creator coverage. A public product record can show visible marketplace activity. It cannot reveal your return rate or landed cost. A strong video can show convincing proof. It cannot prove that the proof caused every order.
| Choice question | Best first source | What it can support | What remains private |
|---|---|---|---|
| Did our product lose traffic or sales rate? | Seller Center Product Analytics | Product funnel, orders, units, and traffic sources | Why the shopper hesitated |
| Is the market still active? | KOLSprite product and shop research | Comparable products, shops, prices, recent fields, creator and video supply | Total market demand and profit |
| Can creators still show useful proof? | Exact product-linked videos | Formats, creators, reach, interaction, and visible commerce fields | Causal lift and future results |
| Should we spend more? | Finance, stock, and support records | Margin, cash risk, returns, stock, and service burden | Nothing: this is the business choice layer |
For a worked case, we searched the US market for “electric spin scrubber.” The first results did not form a clean market. They included facial cleansing devices, bathroom spin scrubbers, drill-brush attachments, and a grill brush. Counting all of them would have made the chance look broader than the seller's real product question.
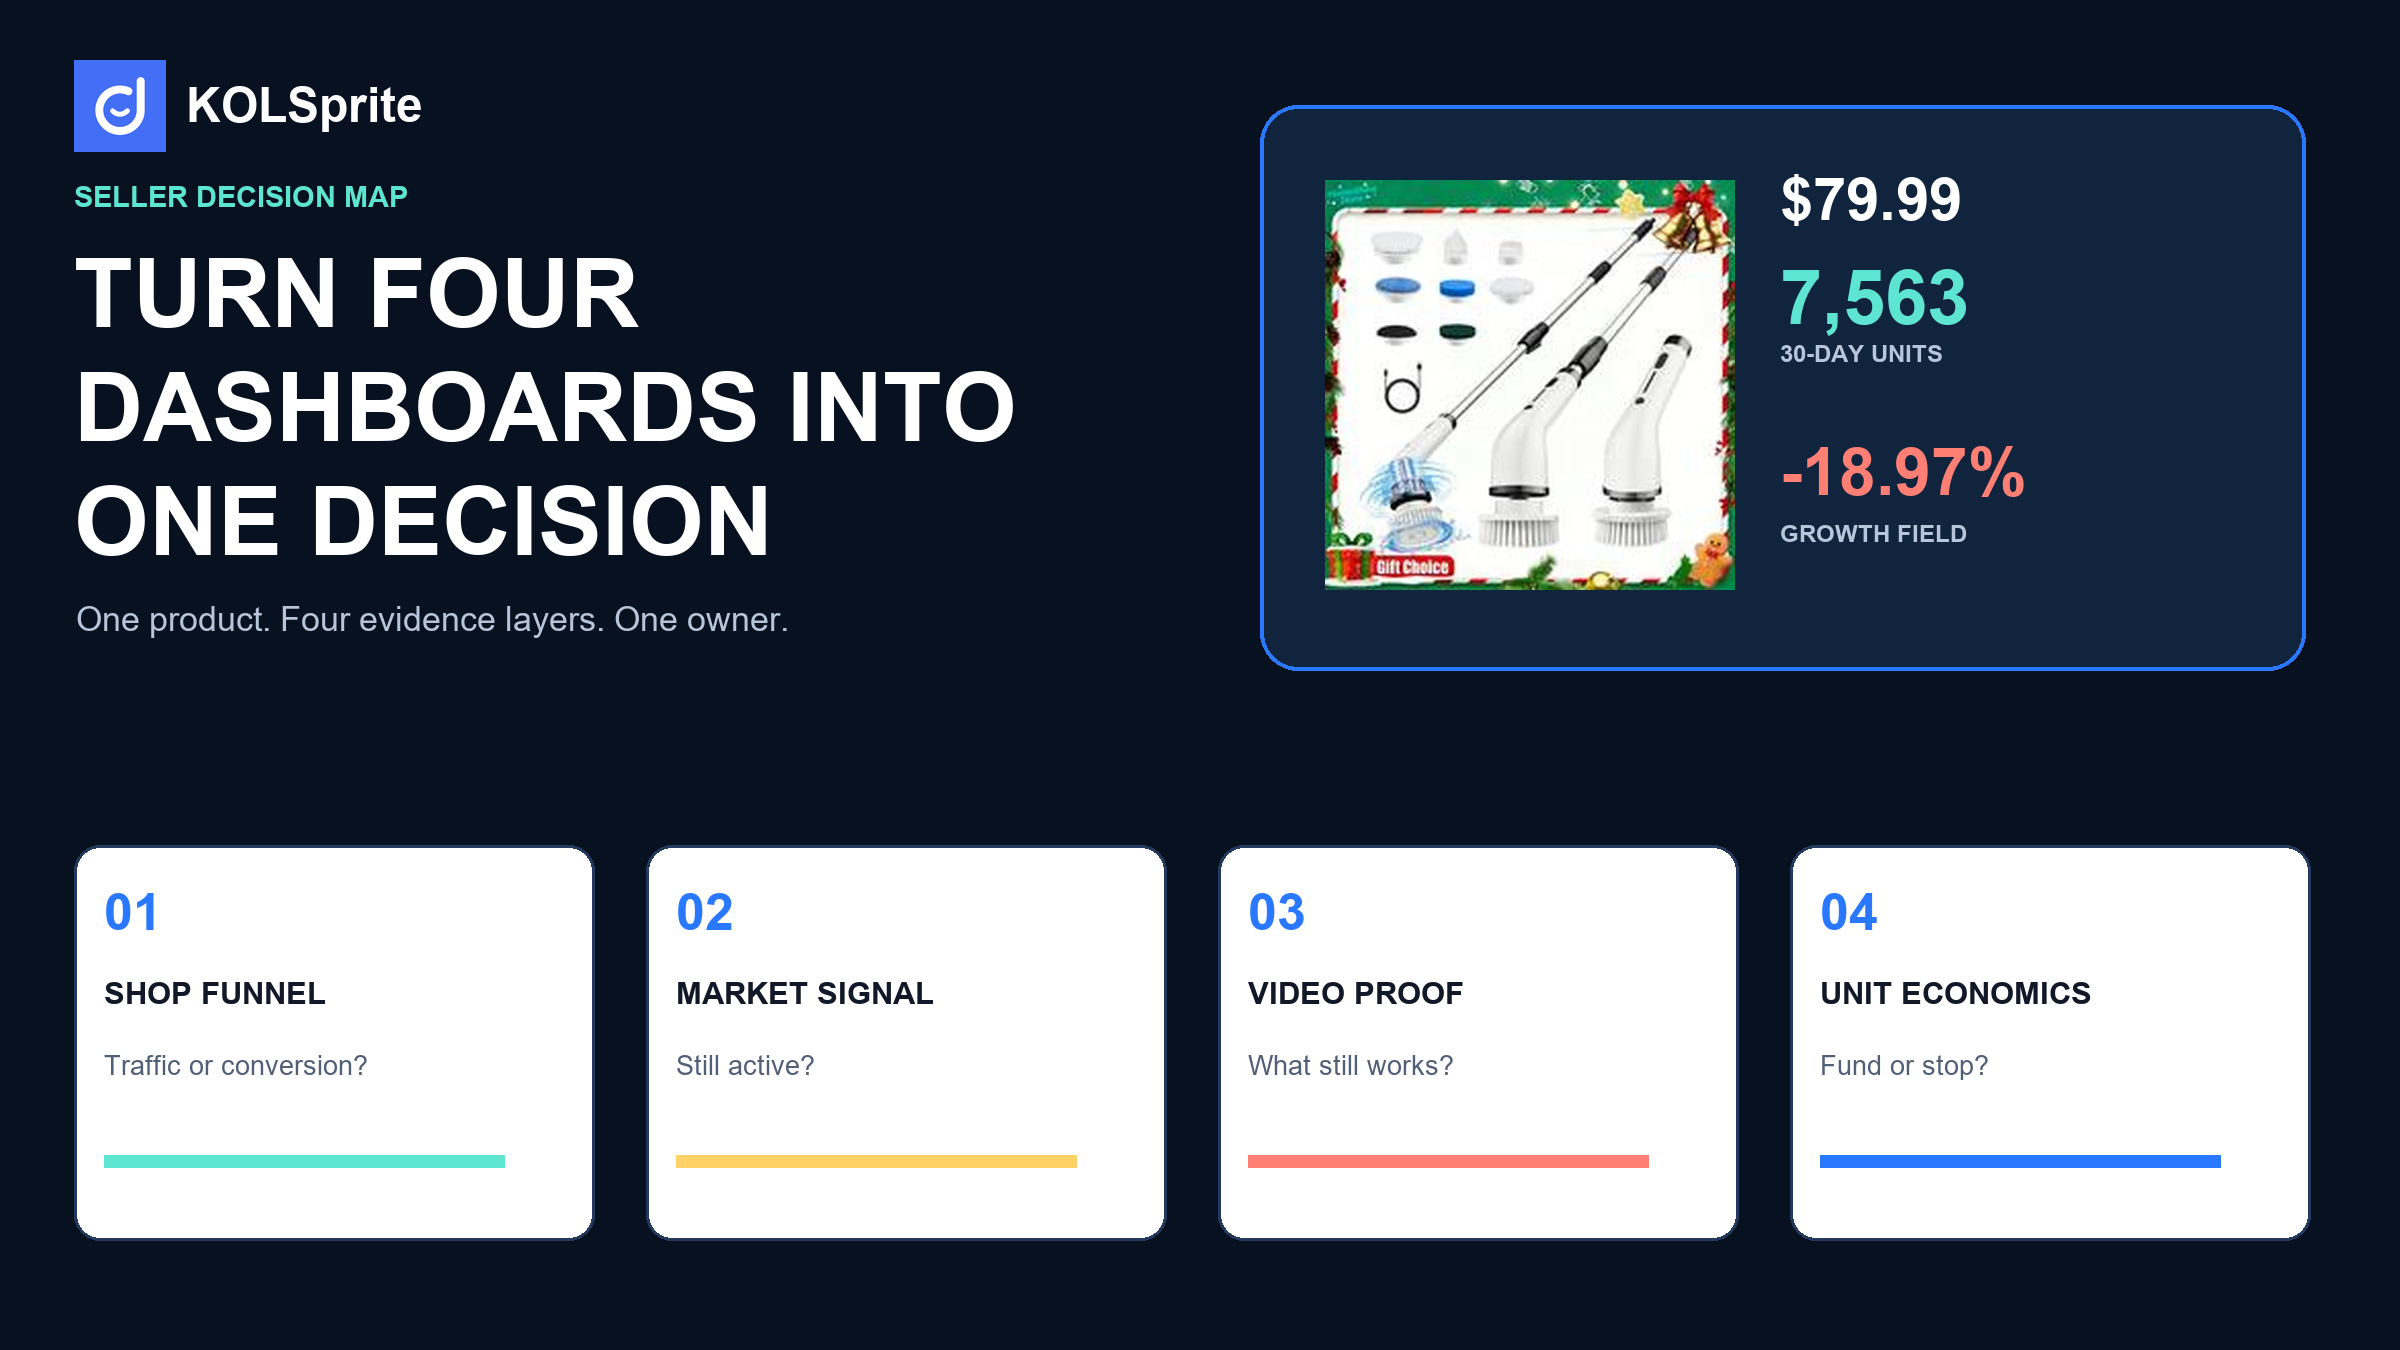
We kept one exact bathroom scrubber from HomeShine Store. Its KOLSprite product record showed a price of $79.99, 7,563 recorded units in the latest 30-day field, a 4.6 rating, 3,735 reviews, 770 linked creators, and 1,620 linked videos. The 30-day growth field was negative 18.97%. The linked shop record showed seven products, a 4.5 rating, 7,586 recorded units in its 30-day field, and 421 videos at the shop level.
The product and shop show nearly the same 30-day unit count. That is the clearest clue in this case. It suggests that this product may account for most of the shop's visible recent unit activity. It does not prove that the shop depends on one item. It does mean the team should review that item first. A weak product period could be a shop-level problem for this seller.
Research note. KOLSprite US product, exact-shop, and exact product-linked video records; accessed July 30, 2026. One five-result product page was cleaned because facial devices and drill attachments did not answer the bathroom-scrubber question. The case is a useful but limited platform snapshot, not a complete market census or a profit forecast.
An exact product ID connected the scrubber to a large set of videos. The first ten records included a 13-second move-in cleaning clip with 14.9 million plays and 5,098 recorded 30-day product units, a 14-second “saves my back and knees” clip with 6.7 million plays and 2,010 units, and a 30-second bathroom-cleaning clip with 6.1 million plays and 1,121 units. Other clips used 15-, 19-, 23-, 25-, 26-, 36-, and 38-second formats.
This is not proof that one duration wins. In fact, the sample argues against a one-rule explanation. The strongest visible product result came from a fast before-and-after moment, while several longer clips also carried meaningful recorded results. The repeated idea was not length. It was relief from a physical or unpleasant cleaning job: move-in dirt, knees and back strain, shower buildup, or a hard-to-reach surface.
That changes the next action. A seller seeing a decline should not immediately make the video shorter or copy the biggest clip. The better question is whether current content still makes the hard job and the visible relief clear. Use KOLSprite video search to follow the exact item and compare proof types without mixing in another brush or another shop.
| Observed signal | Likely question | Next check | Owner | Possible action |
|---|---|---|---|---|
| Own impressions fell; sales rate held | Did traffic supply weaken? | Traffic source and affiliate activity | Growth lead | Refresh distribution, not the listing |
| Traffic held; sales rate fell | Did offer or trust weaken? | Price, shipping, reviews, returns, and product page | Merchandising | Repair offer or page |
| Market videos still show repeatable proof | Is our creative missing the buyer job? | Compare current briefs with product-linked proof | Content lead | Run three proof variants |
| Product activity fell across the market sample | Is the item losing urgency? | More products, shops, and date windows | Market analyst | Reduce exposure or hold |
| Margin or returns fail | Is recovery worth funding? | Contribution margin and return reasons | Finance and operations | Stop, reprice, or redesign |
For this scrubber, the public market evidence supports a content and offer review. It does not support a large stock order. The visible product remains active and several creators can demonstrate a clear job. Yet the negative recent growth field, high listed price, and apparent shop concentration create risk. The correct public-evidence verdict is “diagnose and run a capped test,” not “scale.”
If impressions are down, do not rewrite the entire product page first. Check whether affiliates stopped posting, paid traffic changed, or Shop Tab visibility declined. If product-page views are steady but orders fall, inspect the offer, delivery promise, rating trend, and return reasons. If sales rate is healthy but volume is down, the constraint may be traffic supply rather than product appeal.
When the content branch is the likely problem, use the product-linked examples to write three original briefs. One can show the “move-in ready” surprise. One can focus on avoiding knee and back strain. One can show the tool reaching a surface a normal brush misses. Keep the product, price, landing page, and measurement window stable enough to compare. The goal is not to recreate someone else's clip. It is to test three buyer jobs the market evidence made visible.
The KOLSprite product-search workflow is useful before this branch because it keeps the exact product, shop, and connected content together. The Amazon-to-TikTok validation guide is the next step when the same item also depends on Amazon demand, reviews, fees, or returns.
Use the same order every week. It prevents market research from replacing first-party analytics and prevents first-party analytics from hiding a broader market change. It also makes the handoff clear. Content does not own margin. Finance does not own the proof shot. The analyst owns the map that connects them.
Public TikTok records cannot tell you your landed cost, paid traffic efficiency, refund reason, stock age, creator quote, or sales rate rate. A recorded unit field should not be presented as audited revenue or guaranteed attribution. A ten-video sample cannot define the whole market. The choice map works because it leaves these limits visible instead of filling them with guesses.
Official TikTok Shop analytics should remain the owner of your shop funnel. KOLSprite adds the connected product, shop, video, and creator context around that funnel. Your business systems finish the choice. When all three layers point in the same direction, the team can act with more confidence. When they disagree, the disagreement tells you what to test next.
Keep the electric spin scrubber in a capped focused test. Do not increase stock from public activity alone. Verify the decline inside Seller Center, test three distinct proof jobs, review the current offer and return reasons, and set a stop rule tied to contribution margin. The next meeting should review that choice, not five disconnected charts.
Create a KOLSprite account and claim a three-day trial membership. Use the trial to research products, inspect linked videos, and check the evidence before you act.
Register for a three-day KOLSprite trial
Bring one confusing product signal and compare the next check with other operators.
 +
+
Join the KOLSprite Discord community
Latest Articles

As an essential, data-driven toolkit for TikTok influencers and marketers, KOLSprite provides powerful features for effortless creator discovery, trending content identification, and actionable real-time insights.
It empowers users to make smarter decisions and significantly boosts their TikTok business.

 Refer & Earn