 +
+
A TikTok engagement calculator can turn public response data into one rate. The inputs often include likes, comments, shares, views, and followers. That rate is useful only when you know the denominator and the decision. This guide is for brands, agencies, and TikTok Shop sellers comparing creators. It explains two common formulas and one real creator example. It also gives you a five-part review card for fit, recent content, proof, and campaign readiness.
Use view-based engagement for the response to a specific video or recent video set. Use follower-based engagement for a rough profile-level comparison when view data is unavailable. Never compare rates built with different formulas. Then check the actual videos, audience context, product history, and data window before you contact the creator.
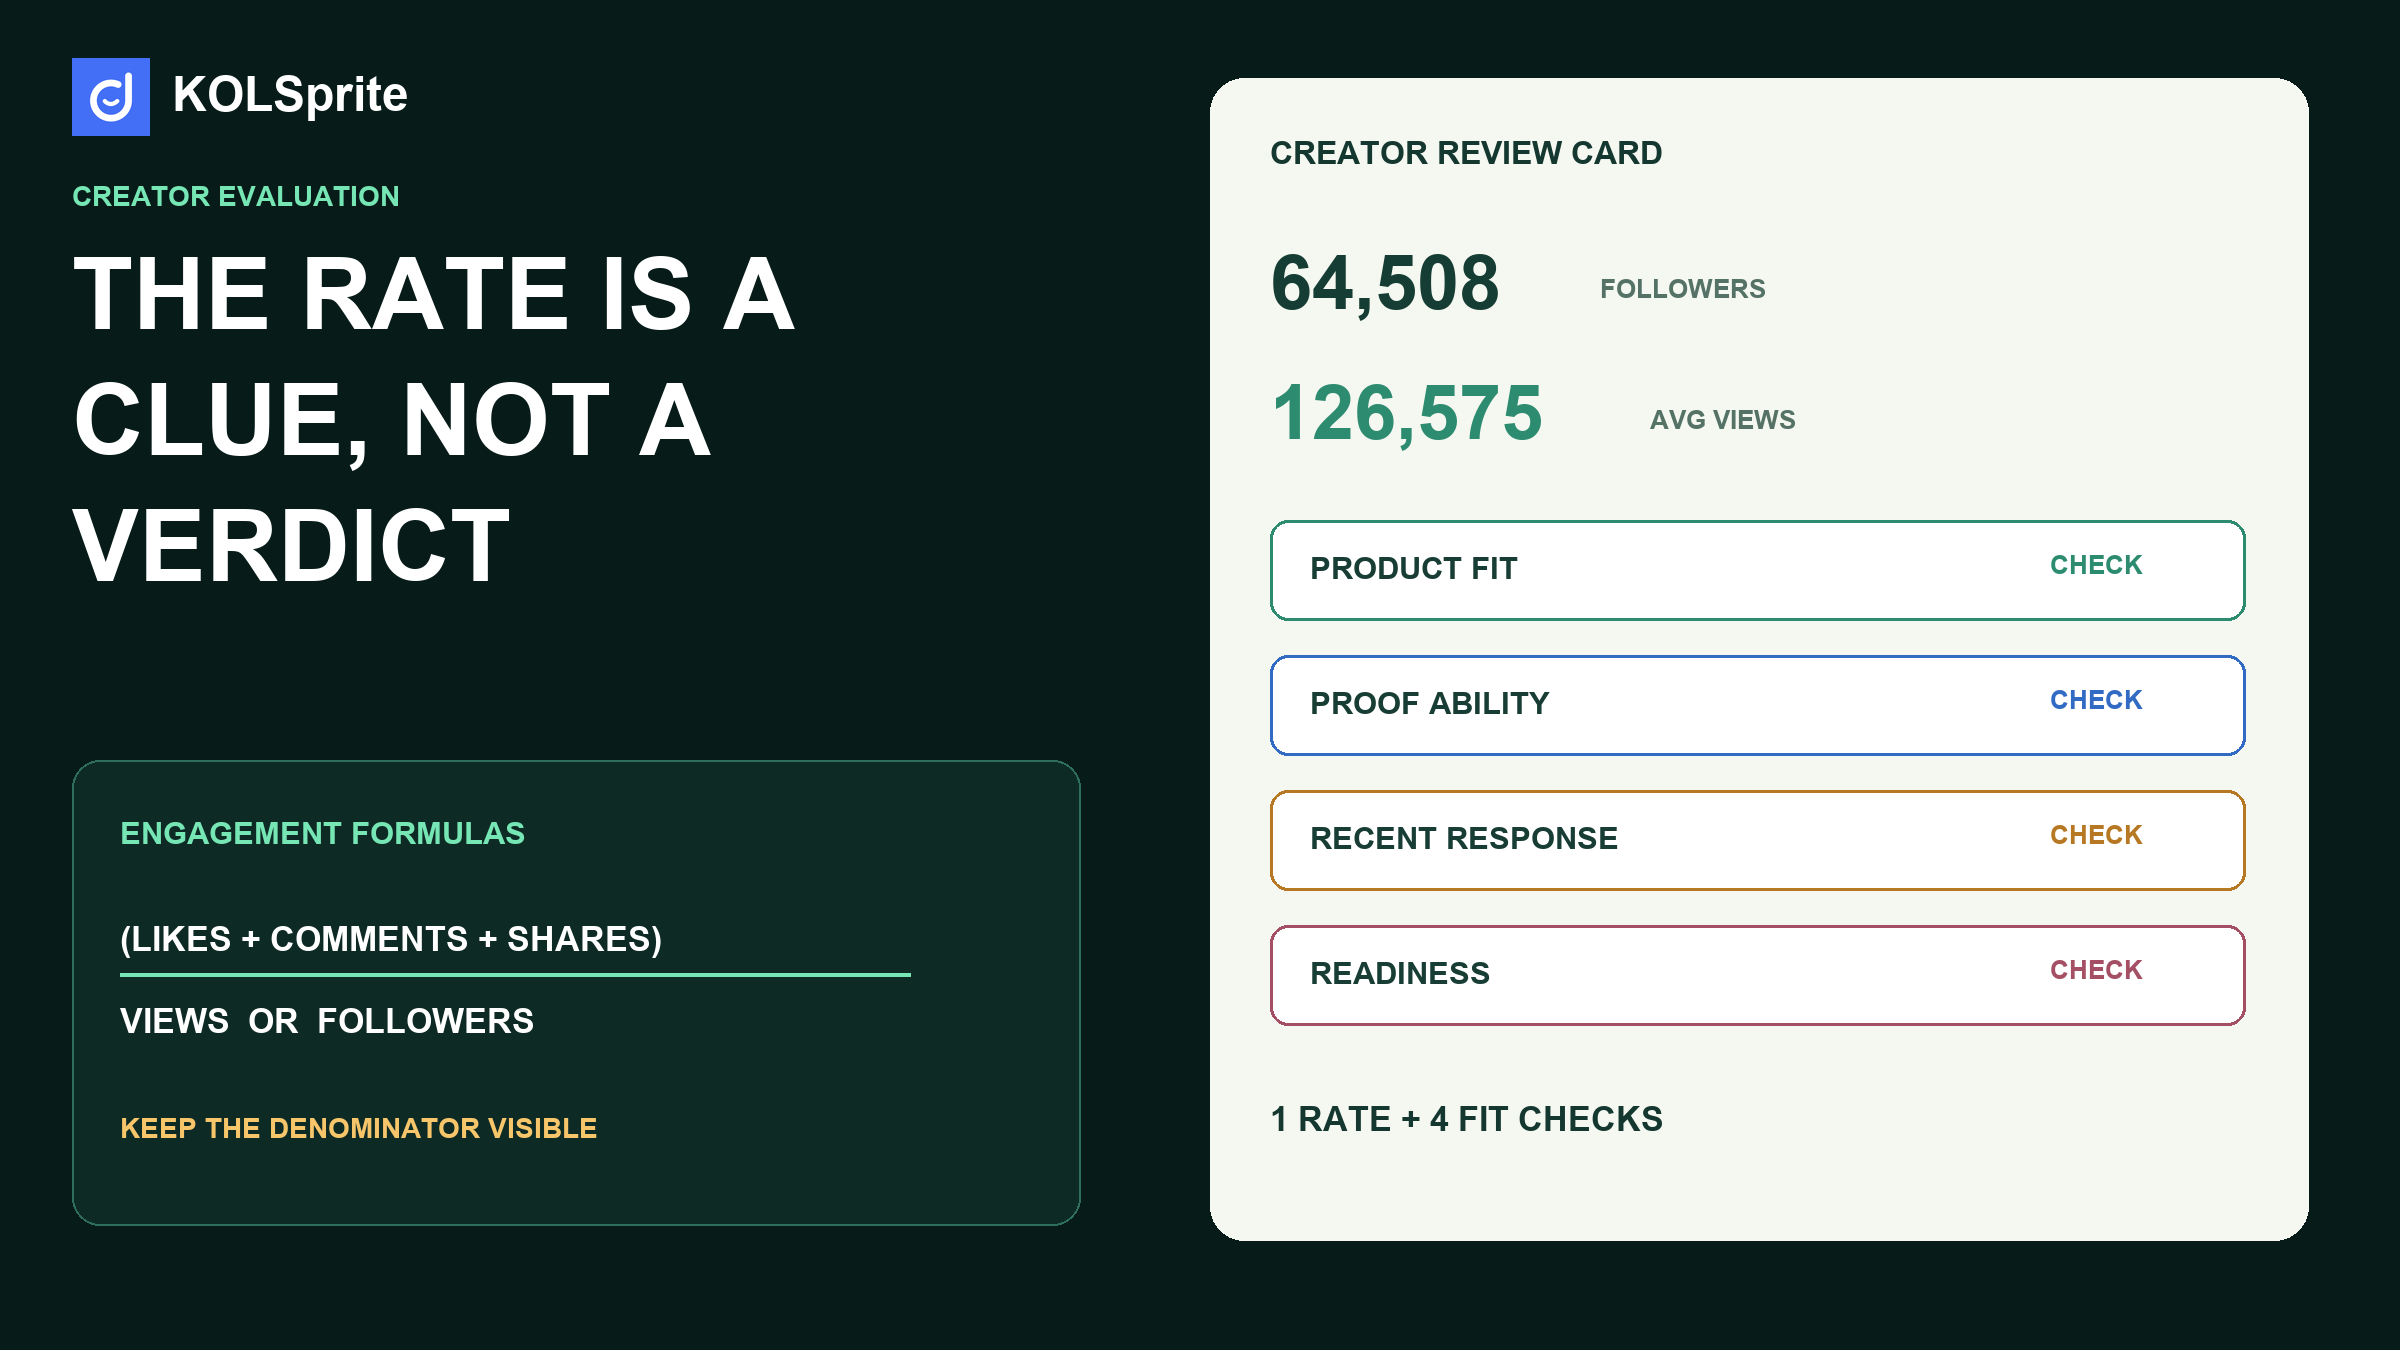
The follower-based formula is: average engagements divided by followers, multiplied by 100. It asks how much visible response a creator gets relative to the size of the account. The view-based formula is: engagements divided by views, multiplied by 100. It asks how much response a video gets relative to the people who watched it.
On TikTok, the two answers can differ sharply because distribution is not limited to followers. A creator with 20,000 followers may receive 200,000 views on one strong clip and 5,000 on the next. Follower-based engagement can make the first clip look unusually high. View-based engagement can make a widely distributed clip look lower because the denominator is much larger. Neither is automatically wrong. They describe different relationships.
TikTok provides public guidance on basic reporting metrics for advertisers. The available fields and definitions depend on the product and report. This is another reason to write the formula and source beside a calculated rate instead of assuming every dashboard uses the same rule.
| Question | Preferred denominator | Reason |
|---|---|---|
| How did this video convert attention into response? | Views | The rate stays tied to actual exposure. |
| How active is this account relative to its follower base? | Followers | Useful as a rough profile comparison. |
| Which creator should receive a product sample? | Neither alone | Fit, proof ability, recent content, and logistics matter. |
| Did the campaign improve? | Consistent campaign metric | The formula and window must stay the same. |
A profile rate may use an average from ten videos. A campaign rate may use total engagement divided by total views. A calculator may include likes and comments but omit shares and saves. If you compare those numbers as if they were the same metric, the ranking will be false.
Every rate needs its formula, period, video count, and fields. “3.2% engagement” is incomplete. “3.2% by views across the latest ten organic videos, using likes, comments, and shares” can be reviewed and repeated.
Suppose a video has 100,000 views, 2,000 likes, 100 comments, and 400 shares. The visible engagement total is 2,500. Divide 2,500 by 100,000. Multiply by 100. The view-based rate is 2.5%.
Now suppose the creator has 25,000 followers. The same 2,500 interactions equal 10% by followers. Both numbers are correct under their formulas. They answer different questions. Showing only “10% engagement” could make the video look stronger than it was among viewers. Showing only 2.5% could hide the fact that the clip reached far beyond the follower base.
KOLSprite helps teams inspect creator, video, category, and commerce context before outreach. Register to claim a three-day trial membership.
Start a three-day KOLSprite trial
KOLSprite MCP returned a public US creator record for @cozyhomewithali on August 5, 2026. The snapshot showed 64,508 followers, 4,370,809 total likes, and 3,452 videos. It also showed about 126,575 average views per video and a 1.69% interaction-rate field. The creator covered many contexts, including home, food, beauty, fitness, family, and technology.
The same creator appeared in a product-linked portable-blender video. The accessed record showed 7.3 million plays, 167,200 likes, 617 comments, and 32,000 shares. Likes, comments, and shares produce a view-based rate of about 2.74% for that video. Other interaction types would change the result. A different data window would also change it.
The lesson is not that 1.69% or 2.74% is “good.” The profile field and our simple video calculation are not the same metric. The profile covers a broader source window and may use a platform definition. The video calculation uses one record and a stated formula. They should prompt inspection, not be averaged together.
Research note: one public creator record and one linked commerce-video record, US market, accessed August 5, 2026. Public metrics can change. The example does not include private audience demographics, fraud analysis, contract terms, attribution, or campaign results.
| Dimension | What to inspect | Decision question |
|---|---|---|
| Product fit | Exact categories, use cases, and product history. | Can this creator explain our item credibly? |
| Proof ability | Full demos, comparisons, setup, and objection handling. | Can the camera show what the buyer needs? |
| Recent response | Consistent formula across a recent video set. | Is response stable or driven by one outlier? |
| Audience context | Language, region, comments, topics, and visible community cues. | Does the likely audience match the campaign? |
| Readiness | Contact path, posting cadence, disclosure habits, and brief fit. | Is outreach practical now? |
Each dimension can be marked pass, verify, or stop. The card should not become another weighted percentage unless your team has tested those weights. A clear “verify audience geography” is more actionable than a 78/100 score that hides the missing field.
Category, account size, format, and video age can change the normal range. A beauty tutorial, a comedy clip, and a product setup video invite different actions. The fairest comparison uses creators doing a similar job, with the same formula and recent window.
One rate below a broad internet benchmark is not a reason to reject a creator. The actual work may show excellent product proof, steady views, and the right audience. Another creator may have a high rate driven by unrelated personal posts. The campaign needs fit, not a leaderboard trophy.
KOLSprite Creator Search narrows creators by supported public signals and category context. The profile and recent videos show whether the visible work matches the rate. The extension supports creator-profile inspection while you browse, and product-linked records can show whether the creator has worked around the product job you care about.
KOLSprite does not guarantee audience authenticity, sales, or campaign return. It also does not make every engagement field directly comparable. Confirm definitions and time windows. Your brief, offer, rights, margin, tracking, and campaign results still decide whether the partnership works.
A useful set has five to ten recent organic videos that match the creator’s normal work. Paid boosts or pinned outliers may not compare fairly. Any exclusion should stay in the record. One method adds likes, comments, and shares across the set, then divides by total views. Another method finds each video rate and reports the median. The median reduces the effect of one outlier.
The same method belongs on every creator in the shortlist. Switching to followers because one view rate looks weak breaks the comparison. Missing fields should remain missing. A smaller comparable set is more useful than a larger mixed set.
High response may come from controversy, a giveaway, an unrelated personal story, or a product question. Low comments may sit beside strong saves and shares. The creator may be excellent at entertainment but weak at explaining a product mechanism. Open the content that created the number.
Repeated viewer language, clear demonstrations, and honest limits are useful clues. A portable-blender buyer may ask, “Will it leak in a bag?” A creator who can answer that question on camera may be highly valuable. A higher general profile rate cannot replace that proof skill.
The card ends with one action: contact, watchlist, request more data, sample test, or reject. The reason fits in one sentence. For example: “Sample test for a relevant home-routine audience and strong demonstrations. Verify usage rights and recent view consistency before a paid brief.”
The first step is a short campaign job, such as a setup demo, a warm routine video, or an answer to a hard buyer question. The job comes before the number.
The second step is one recent window for every creator. Five to ten normal posts is often enough for a first pass. A pinned outlier can be excluded when it does not reflect normal work, as long as the record shows that choice.
The third step records views, likes, comments, and shares. The interactions are divided by views, and the formula stays visible. A missing share field stays missing rather than becoming a guess.
The fourth step reviews three videos: one with strong reach, one typical post, and one recent post. The plain question is whether this person can show the product in a way a buyer will trust. The answer may be no even when the rate is high.
The fifth step names the action, reason, and open check. A useful note is: “Contact for a sample demo. Confirm US audience, recent view range, and rights before the paid brief.” This gives the outreach owner a clear start.
It cannot tell you whether the audience can buy in your market. It cannot tell you whether the creator will follow the brief. It cannot tell you whether comments came from buyers. It cannot tell you whether the offer will make money. It cannot tell you whether the creator has time next week.
Those limits are not a reason to ignore the rate. They are a reason to keep the rate in its proper place. Use it to spot an unusual result. Then inspect the work. A useful metric starts a question. It does not end the decision.
Post an anonymized creator card with the denominator, video window, and one unresolved fit question. That gives other operators enough context to offer useful feedback.
 +
+
Join the KOLSprite Discord community
Views fit a video-level rate. Followers fit a rough profile check. The two rates should not be compared, and the denominator belongs beside every result. This one habit prevents many bad comparisons.
Yes, when the same field is present for every creator in the set. Shares can show that a viewer passed the video along. If the field is missing, leave it out for everyone. State that choice in the note.
Include saves only when the data source gives a clear and comparable value. Do not estimate saves. A missing value is not zero. Mark it as missing.
No. One video can show a useful format. It cannot show normal creator performance. Review a recent set. Use the viral post as an outlier or a case, not as the whole profile.
Look at the recent work that matches your product. A broad category list can show range. It does not prove fit. The actual videos matter more than a long list of labels.
The campaign job breaks the tie. The proof, audience clues, timing, and offer matter next. The rate has already done its work by creating a closer comparison.
You do not need a large dashboard for the first pass. A sheet with one row per creator is enough. Keep the formula, date, window, fit note, proof note, and next step. Link the source profile and the videos you watched.
Review the sheet with the outreach owner. Remove anyone who fails a hard fit check. Put open items in plain words. Then contact only the creators whose next step is clear. This saves samples, time, and follow-up work.
A high rate sits beside weak product proof. The creator may be good at reach but wrong for this job.
One post drives most of the result. The recent median will show whether that spike is normal.
The strongest comments discuss a topic unrelated to the product. That response may not help a sales brief.
The audience market is unclear. A sample should wait until the team can check language, location clues, and buying access.
The formula is missing. Without a clear denominator and window, the percentage cannot support a fair comparison.
The note can be brief. Name the campaign job first. Add the rate and its formula. Add the dates and video count. Link the posts you checked. State the strongest proof skill. State the main gap. End with one next step.
Here is a plain example. “Sample test for a kitchen demo. Recent view-based rate checked across eight posts. The creator shows setup well and answers buyer questions. US audience fit still needs a check. Send the sample only after rights and timing are clear.”
That note is easy to scan. It also leaves room for doubt. A teammate can check the source and challenge the choice.
A TikTok engagement calculator should make the first comparison faster, not replace the creator review. Use the creator engagement benchmark guide to add category context, then apply the creator outreach workflow only after the fit questions are answered.
Latest Articles

As an essential, data-driven toolkit for TikTok influencers and marketers, KOLSprite provides powerful features for effortless creator discovery, trending content identification, and actionable real-time insights.
It empowers users to make smarter decisions and significantly boosts their TikTok business.

 Refer & Earn